


 The 200-day SMA is perhaps the most widely used long-term moving average. As its name implies, it is a simple indicator that chartists can use for trend-following and momentum strategies. For trend-following, we just need to know where prices stand relative to the 200-day SMA. For momentum, we need to measure the distance between price and the 200-day SMA. Let’s look at examples from two Nasdaq 100 stocks.
The first chart shows Apple (AAPL) with the 200-day SMA in red and the 5-day SMA in green. I also like to smooth closing prices with a 5-day SMA to reduce whipsaws (bad signals). The blue circle on the chart shows a whipsaw in late October. “Reduce” is the key word here because we can not fully eliminate whipsaws. The red circle shows the 5-day SMA breaking decisively below the 200-day SMA in late February. AAPL is in a downtrend and not being considered for our dual-momentum strategies.
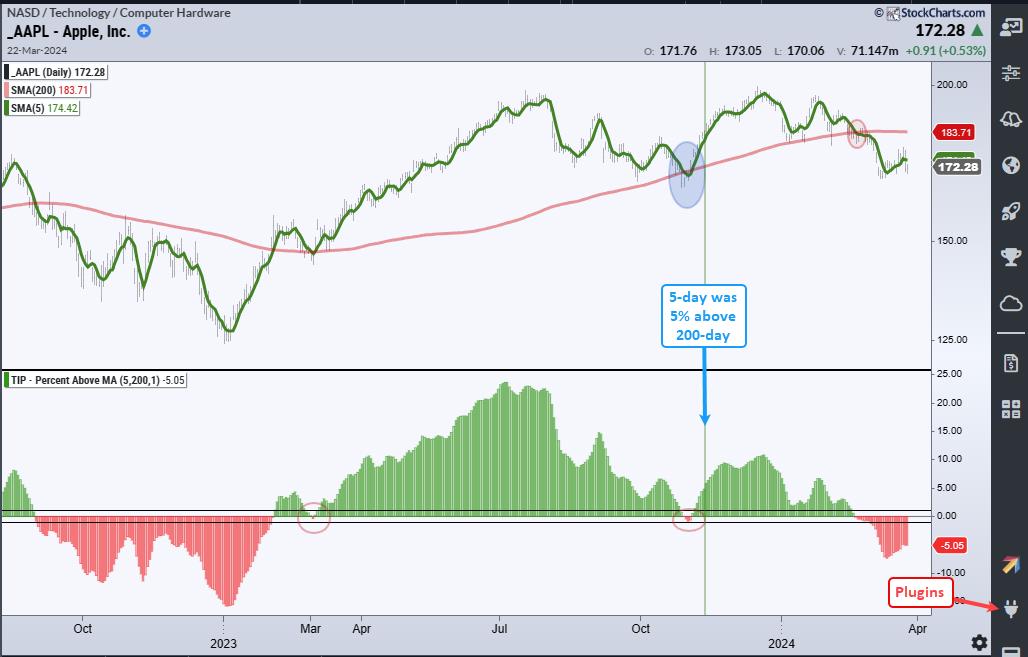
The indicator window shows the percentage distance between the 5-day SMA and 200-day SMA. This indicator can further filter signals and reduce whipsaws by adding a bullish threshold at +1% and a bearish threshold at -1%. An uptrend signals when the 5-day is more than 1% above the 200-day and a downtrend signals when the 5-day is more than 1% below the 200-day. This little filter would have avoided the whipsaws in late October and mid March (red circles).
Chartists can also use Percent above MA (5,200) to quantify the strength of the trend. AAPL was still in an uptrend in early November, but the 5-day was only 5% above the 200-day SMA on November 9th (green line). Keep this number in mind as we move to the second chart, Broadcom (AVGO). The chart below shows AVGO triggering bullish in December 2022 as the 5-day SMA was more than 1% above the 200-day SMA (green circles). Note that this indicator is part of the TIP Indicator Edge Plugin for StockCharts ACP.
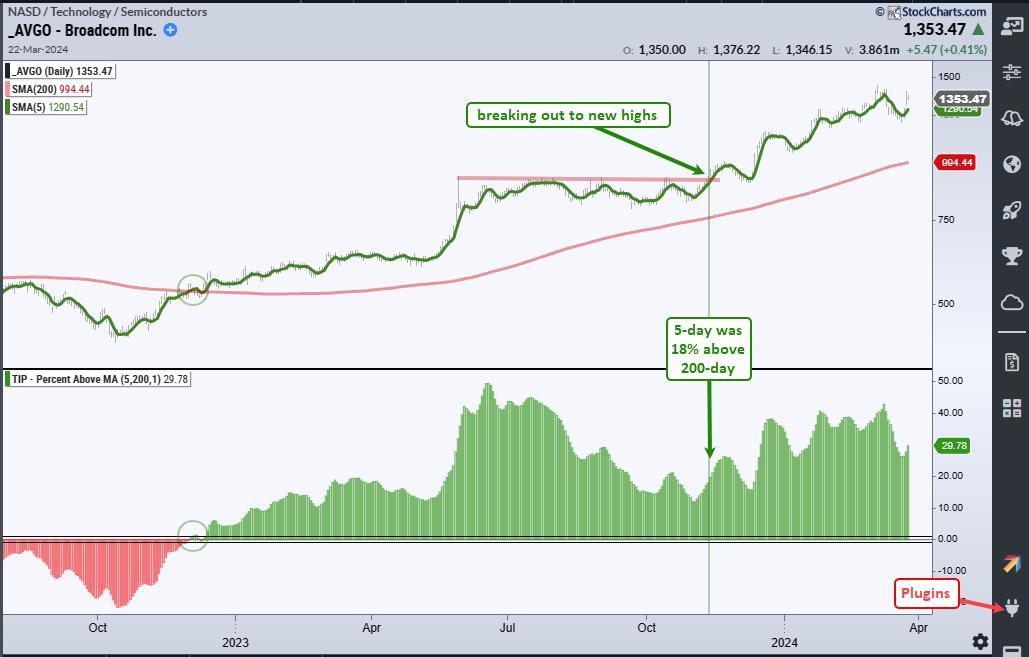
The green line marks November 9th and the 5-day SMA was 18% above its 200-day SMA on this date. This means it was much stronger than AAPL, which was only 5% above its 200-day. AVGO clearly won the momentum contest in early November. The stock was also breaking out to new highs in early November (red line). AVGO remains one of the leaders in the Nasdaq 100 because its 5-day SMA is almost 30% above its 200-day SMA. Chartists trading momentum strategies would still be focused on AVGO because it is in an uptrend and leading. This is the essence of dual-momentum.
TrendInvestorPro offers momentum-rotation strategies that trade stocks in the Nasdaq 100 and S&P 500. These strategies are fully systematic and trade on a weekly basis. Rankings and signals are posted every Saturday morning for subscribers. Click here to see performance metrics and learn more.
//////////////////////////////////////////////////