Bitcoin is about to undergo its fourth halving on April 19. For crypto enthusiasts, it’s well known that this halving occurs every four years and is a critical event that can significantly alter Bitcoin’s market dynamics as it affects the coin’s supply mechanism.
How Has Bitcoin Halving Affected Price?
The following significant strides followed each price halving:
- First halving in 2012 saw Bitcoin’s price rise from $12 to $900 in the years following.
- Second halving in 2016 saw the price climb from around $600 to $2,500 in a year.
- Third halving in 2020 saw prices surge from approximately $8,000 to $40,000 in less than a year.
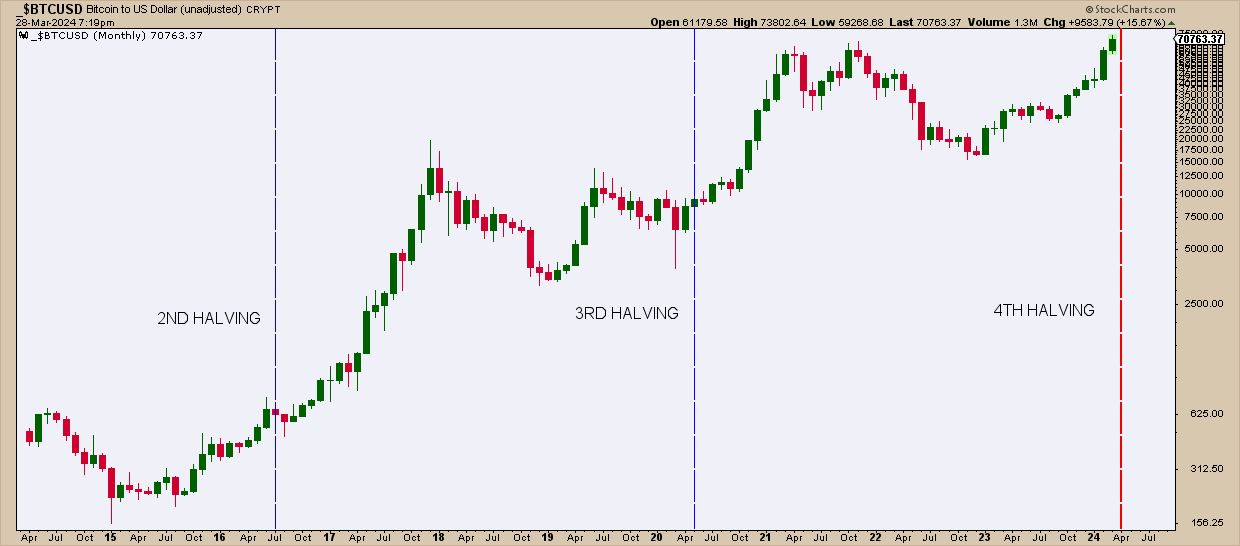
CHART 1. MONTHLY CHART OF BITCOIN. Here you see the price action following the second and third halving. How much will price rise after the fourth halving?Chart source: StockCharts.com. For educational purposes.
Still, correlation is not causation, and these halvings might simply be reference points marking surges driven by various other factors.
But what if Bitcoin’s post-halving supply does play a significant role in its price surge? What if a decrease in supply stokes demand to the point of FOMO? Is it a good time to jump in now, or how can you time an entry?
A Strange Concept: Bitcoin Seasonality
Some cryptanalysts will argue that Bitcoin is seasonal. But while it does have seasonal data, seasonality is another matter altogether, as it implies internal supply/demand mechanisms happening consistently within a calendar year.
Still, the context is something you might want to be aware of in your attempt to time an entry.
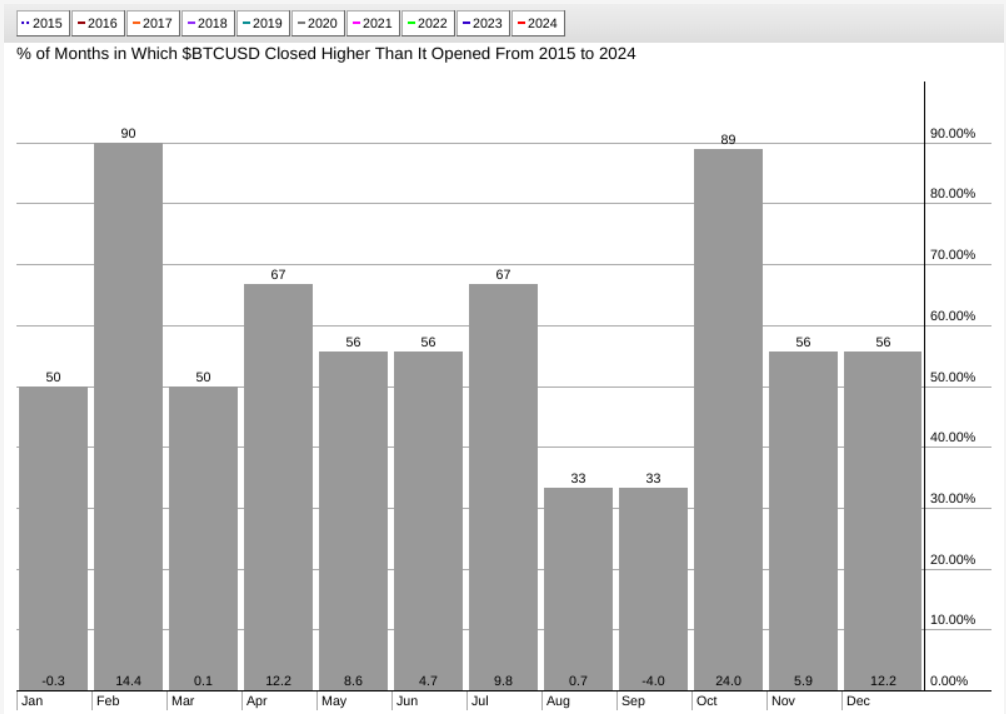
CHART 2. BITCOIN’S 10-YEAR SEASONAL PERFORMANCE. Most of the months have exhibited strength in returns and higher closes (mainly because Bitcoin has constantly been subject to hype and FOMO).
Chart source: StockCharts.com. For educational purposes.
Using StockCharts’ Seasonality tool, Bitcoin’s 10-year seasonal performance shows that October and February tend to be its strongest months, with a higher-close rate near or at 90% and an average return rate of 24% (October) and 14.4% (February).
But the combination of April, May, and June, three consecutive months, also presents an appealing opportunity. How does Bitcoin’s 10-year seasonal performance compare with the S&P 500?
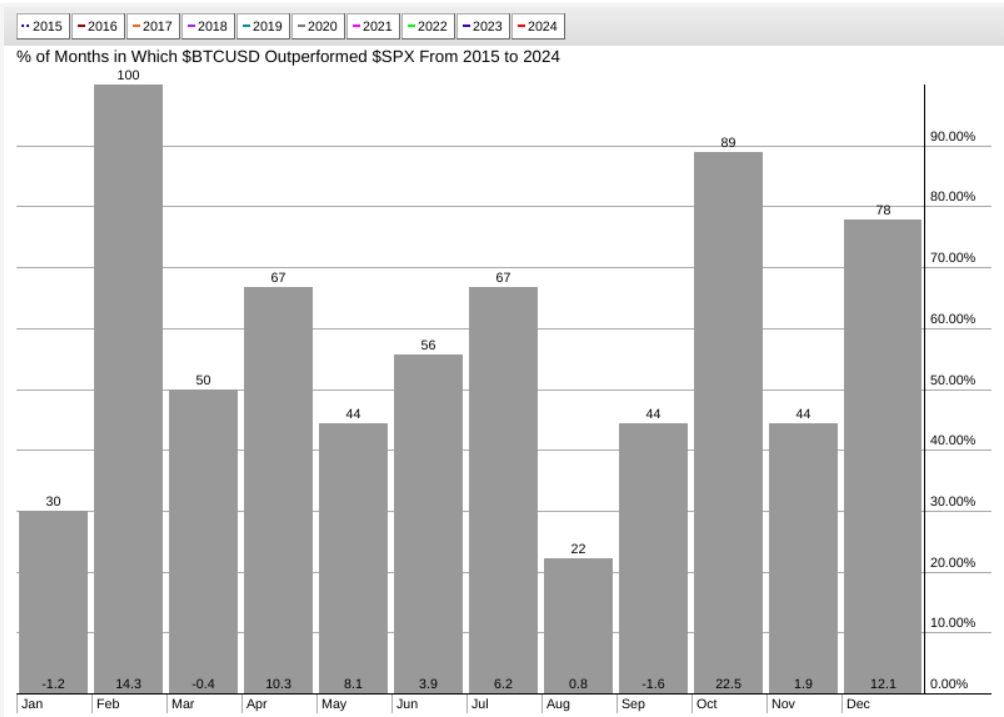
CHART 3. 10-YEAR PERFORMANCE OF BITCOIN AGAINST THE S&P 500. Note how October and February remain the most vital months compared to the broader market.Chart source: StockCharts.com. For educational purposes.
Like the chart above, October and February are Bitcoin’s strongest months. While April through July are relatively strong, April stands out as the strongest among the months in Spring.
How to Access the Seasonality Tool
There are different ways to access the seasonality tool in StockCharts.
- Click the Charts & Tools tab at the top of the StockCharts page, enter a symbol in the Seasonality panel, and click Go.
- Enter the symbol in the ChartBar at the top of the page and select “Seasonality” from the dropdown menu on the left.
- From Your Dashboard, in Member Tools, click on Seasonality.
- Below the seasonality chart, you’ll find links to instructions and quick tips that give more detailed instructions.
So, what does the price action look like today? Let’s turn to the daily chart of Bitcoin to US dollar.
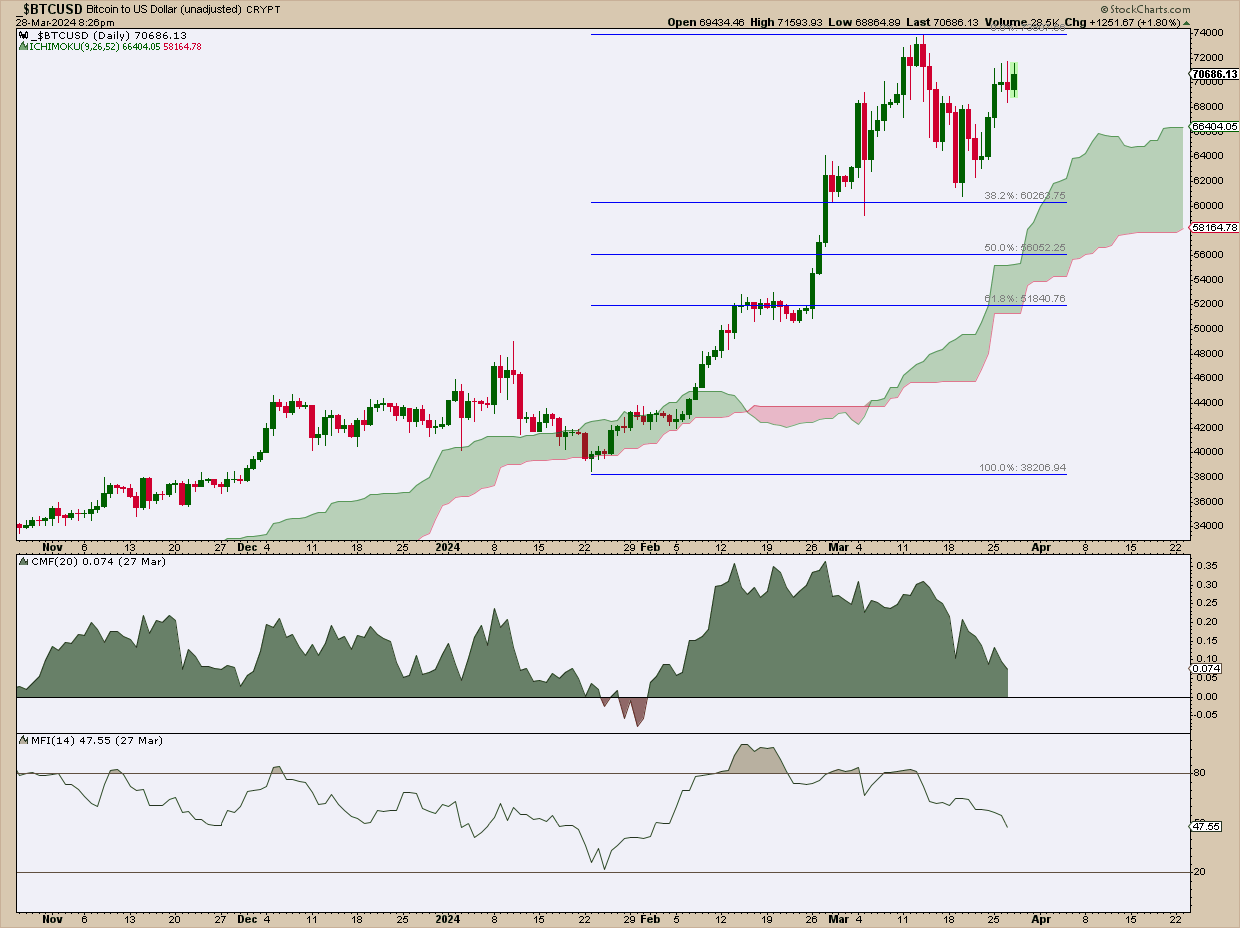
CHART 4. DAILY CHART OF BITCOIN. Note the decrease in momentum and the potential support levels serving as possible entry points for those looking to go long.
Chart source: StockCharts.com. For educational purposes.
Note Bitcoin’s five-day sell-off from March 14 to 19. Perhaps in light of the April halving event, Bitcoin bulls jumped in as prices approached the most recent swing low of just below $60,000. This level also coincides with the 38.2% Fibonacci Retracement drawn from the January 2024 low of $38,512 to the March high of $73,802.

However, note that the bounce lacks momentum, as the Money Flow Index (MFI) and the Chaikin Money Flow (CMF) signal a rapid decrease in buying pressure. However, the MFI is nowhere near “oversold” territory, and the CMF is still above the zero line, which is a bullish sign that buyers still have the technical advantage.
Even if the present rally falters, Bitcoin’s uptrend will remain viable. If a decline as painful as the $56,000 range occurs, the uptrend would remain intact. The Kumo (Ichimoku Cloud) has also been plotted to confirm this “support level” thesis. Notice how the price bounced off the Kumo back in January. The current price action gives a wider range of support-level expectations.
The Bottom Line
While the fourth halving event on April 19 will likely stir up some FOMO, watch the current swing to see whether it continues or pulls back. The coming months are seasonally strong, but seasonality may play second fiddle to the halving event. If it does pull back, you can see the levels where Bitcoin is likely to bounce, serving as a strategic entry point for those looking to go long.
Disclaimer: This blog is for educational purposes only and should not be construed as financial advice. The ideas and strategies should never be used without first assessing your personal and financial situation or consulting a financial professional.