


Cooling July inflation data may have been what the doctor ordered to perk up investor sentiment; the recession fears at the top of investors’ minds early last week are a distant memory, or maybe even erased from their memory. It’s almost as if the August 15 “Panic Monday” never happened. The “soft landing” narrative is back as the stock market sees signs of recovery.
Despite the encouraging news, the stock market didn’t see much movement. This could be because summer vacations may be keeping trading volumes low, which means we could see more sideways movement for a while.
S&P 500’s Price Action at Resistance
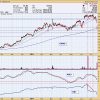
In the chart below, the S&P 500 ($SPX) is at its 50-day simple moving average (SMA), which corresponds with the downtrend from July 16 (red line). It has also crossed above its 21-day exponential moving average (EMA) and the first “line of sand” displayed on the chart (blue dashed line).
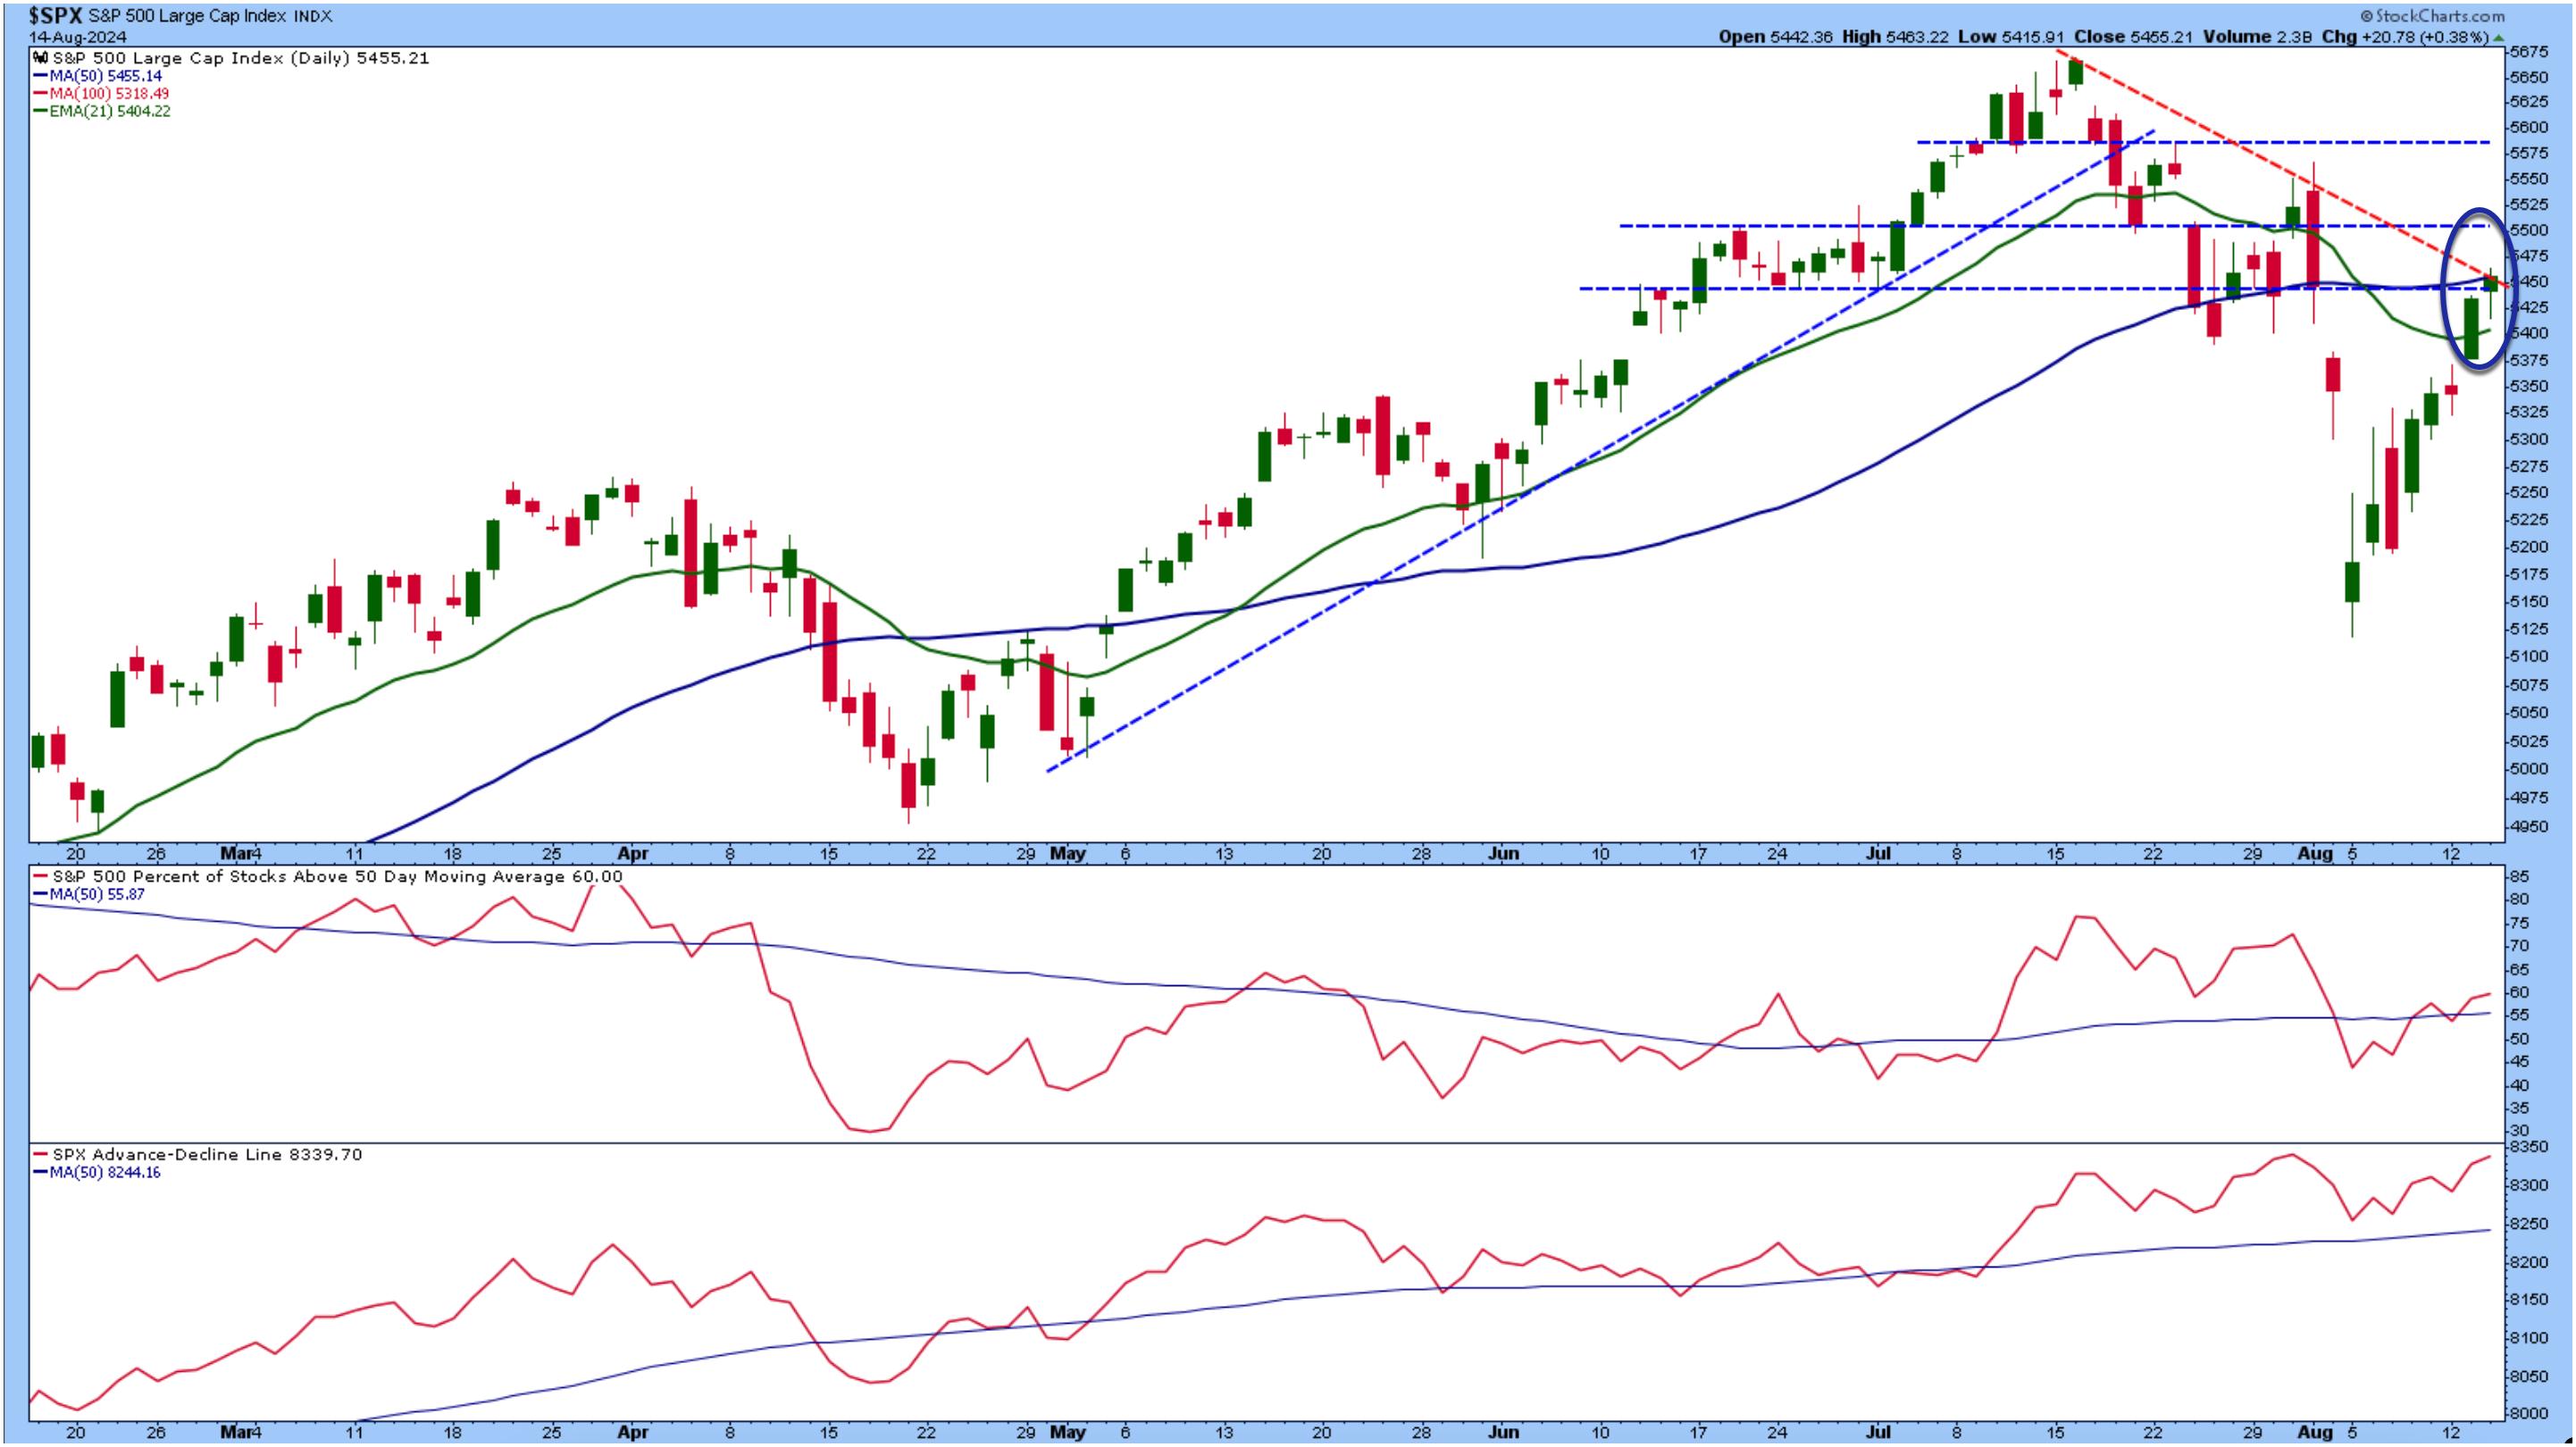 CHART 1. S&P 500 IS AT KEY LEVEL. An upside breakthrough could mean the panic selling from last week is on the back burner.Chart source: StockCharts.com. For educational purposes.
Market breadth indicators seem to be improving, as indicated by the S&P 500 Percent of Stocks Above 50-Day Moving Average and the SPX Advance-Decline Line (see lower panels). A break above the 50-day SMA could take the index to its next resistance level, 5500. But remember, we’re in a slow period, so don’t be surprised if the stock market bounces around this level until next month, when everyone is back.
The S&P 500 is at an important level. If it busts through where it is now and moves higher, there could be many “buy the dip” opportunities. You may need to exercise some patience.
The Federal Reserve is expected to cut interest rates when they meet on September 18. According to the CME FedWatch Tool, the probability of a 25 basis point cut is at 60.5%, when a week or so ago the probability of a 50 basis point cut had the highest odds. The probabilities change, as we’ve seen in the recent past, so it’s a good idea to regularly visit the site especially ahead of the next Fed meeting. At the very least, it gives you an idea of the stock market’s expectations.
Nasdaq 100 Index
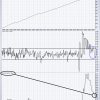
The weekly chart of the Nasdaq 100 ($NDX) shows a reversal just above the 50-week SMA. Even though the Nasdaq 100 has crossed above its 21-day EMA, there’s some hesitancy to follow through. Now that investors feel some relief, they may have put their panic selling on the back burner and returned to getting the most out of the rest of the summer. There may be relatively little trading right now, but at least investors aren’t in panic selling mode.
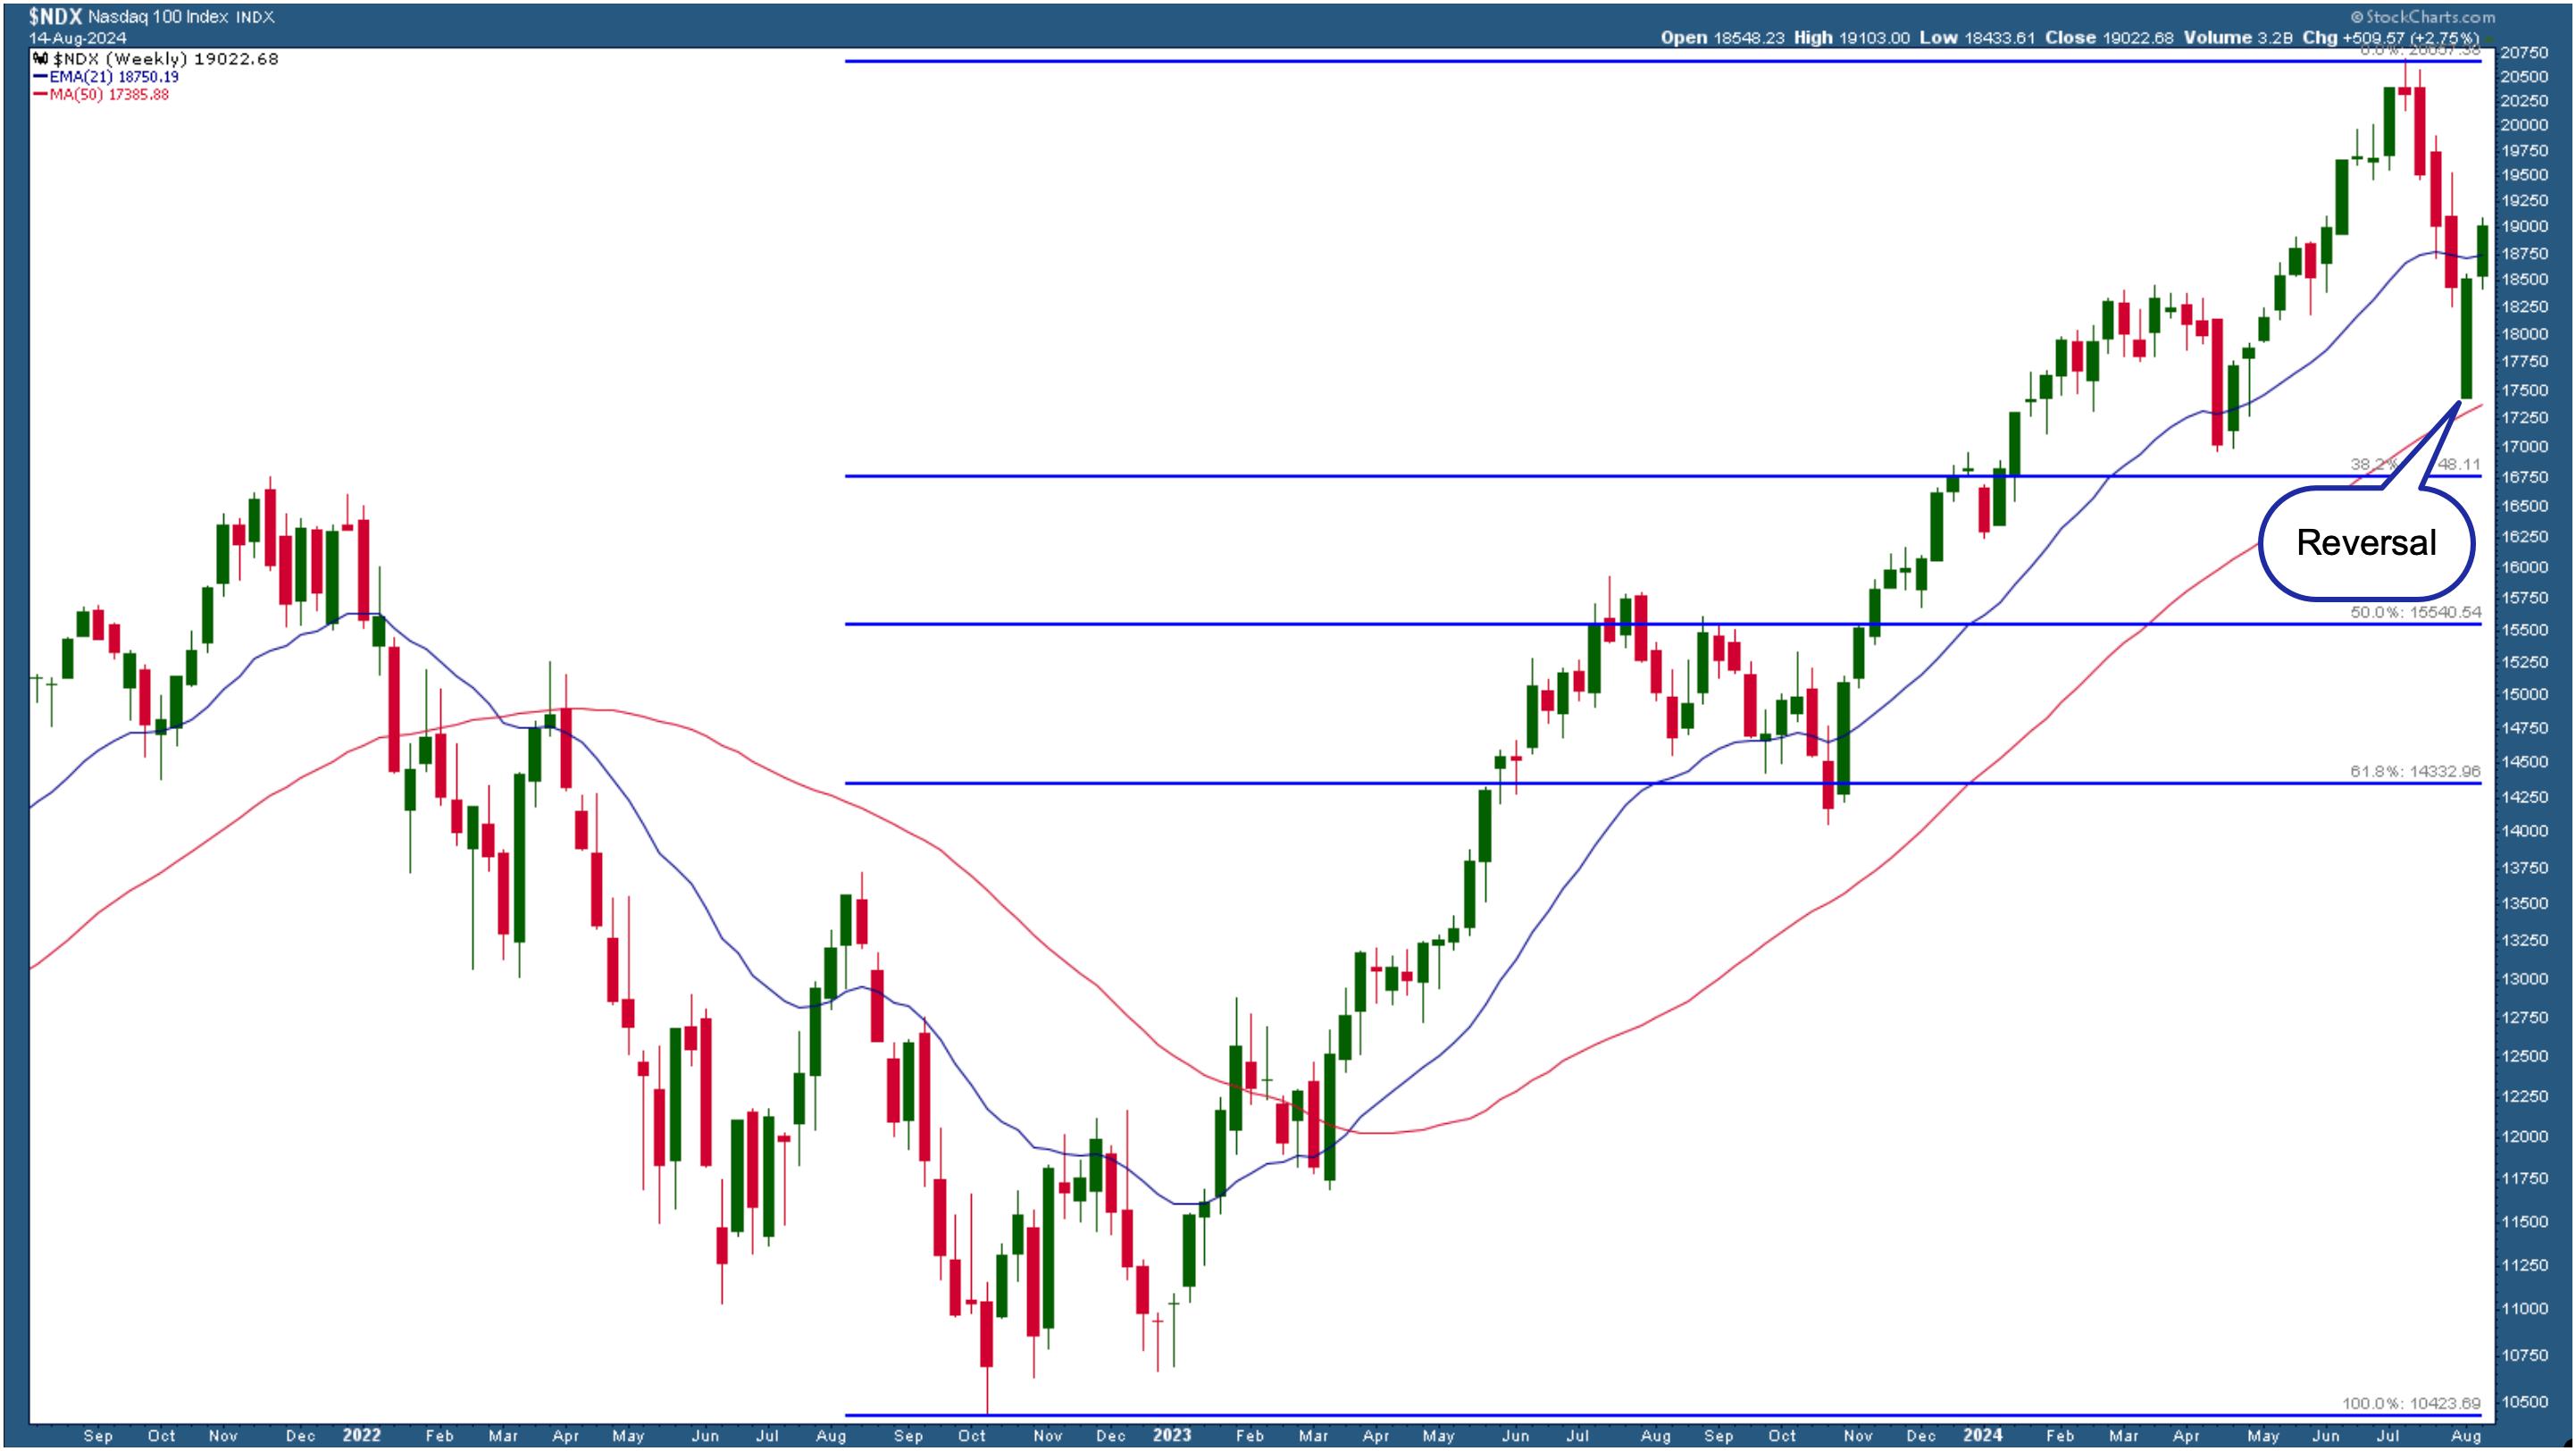
CHART 2. NASDAQ 100 ABOVE 21-WEEK EMA. Can the Nasdaq 100 index maintain its position?Chart source: StockCharts.com. For educational purposes.
The Return of the Mag 7

Does the recent stock market price action mean we’re out of the woods? Well, we never are. But some interesting things are going on beneath the surface that you can’t ignore.
Take the Mag 7 stocks as an example. Most of the stocks are starting to show signs of strength. NVDA, Microsoft Corp. (MSFT), Apple, Inc. (AAPL), and Meta Platforms (META) are off their lows. The CBOE Volatility Index ($VIX) is back below 20 after spiking to 65 after the ISM Manufacturing report. It looks like the stock market is regaining its footing, but investors should tread carefully.
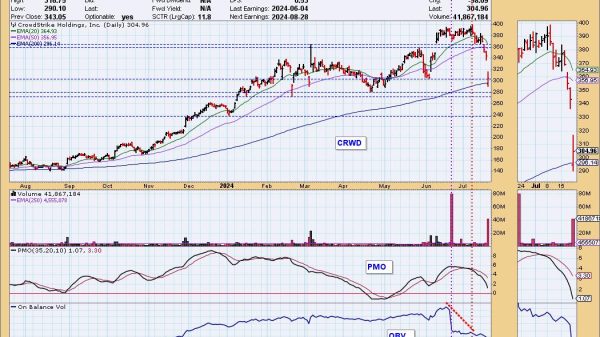
Next week will be relatively light in terms of economic data. The earnings calendar is also thin, but there are some companies investors should focus on. These include Target (TGT) and Lowe’s (LOW), which could shed some light on the retail and housing market. This may not impact the stock market much; what could be more important to watch would be the week of August 26, which is when NVIDIA Corp. (NVDA) and Salesforce (CRM) report their quarterly results.
Closing Position
Create a ChartList of a handful of stocks you’re interested in buying, and apply indicators such as the 21-day EMA, a common one for monitoring shorter-term price action. Set your alerts, and when the time is right, don’t hesitate to jump in. Just make sure to keep your risks low.
Disclaimer: This blog is for educational purposes only and should not be construed as financial advice. The ideas and strategies should never be used without first assessing your own personal and financial situation, or without consulting a financial professional.